
The €6.84 billion court-hour economy
91,234 courts, 17.9% growth in ten months, and two of every three euros spent on court time. Three investment cycles now run in parallel, and each needs its own playbook.
Author: Atte Suominen | Founder and CEO, PADEL1969 | October 2026
| 91,234 Courts counted worldwide, end August 2026 | +17.9% Court growth in ten months, October 2025 to August 2026 | €6.84bn Modelled padel spending in 2026 | 67.2% Share of spending from court rental |
Padel added 13,879 courts in ten months, but the investment case has split into three markets with different rules
FIP counted 91,234 courts at the end of August 2026, up 17.9% on its October 2025 survey, and its first economic impact study puts 2026 padel spending at €6.84 billion, of which court rental accounts for €4.60 billion. Together, the two findings move the investment question from how many courts are built to how much each court earns over its life.
The growth is not uniform. Europe holds 62.5% of the installed base, yet Asia built 31.7% of new courts. Germany and Great Britain project court growth above 100% for 2026; Spain and Italy project 3.0% and 1.9%. Sweden’s FIP estimate is 470 courts lower than a year earlier. A single global playbook cannot price all three situations.
Six findings with direct consequences for capital allocation
1 Supply is still compounding. Courts rose 17.9% in ten months, from 77,355 to 91,234; FIP projects about 20.4% for full-year 2026. Each figure needs its reference period.
2 Two of every three euros pay for court time. Court rental is €4.60 billion, 67.2% of modelled spending. Professional tournaments are €97 million, 1.4%.
3 The player base is 19.4, 27 or 40 million, depending on definition. FIP’s broadest count is 2.1 times the Playtomic and Strategy& active-player estimate; FIP’s own economic model uses 27.15 million.
4 One in three new courts is now built in Asia. Asia’s share of new installations rose from 10.0% to 31.7%, and Asia opened 39.0% of new clubs against Europe’s 37.1%.
5 Germany leads global on-site construction spend at €79 million. FIP projects 111.5% court growth for Germany in 2026, the highest rate among Europe’s growth markets.
6 Spending outlasts supply. Sweden’s FIP estimate fell by 470 courts, yet Sweden remains the seventh-largest padel market by spending in FIP’s model, at €275 million in 2026.
PADEL1969 investment thesis
Padel is best analysed as a portfolio of local court-hour businesses, not as one global equipment or infrastructure market. In build-out markets, the constraint is sustainable utilisation. In consolidating markets, it is protecting yield and renewing ageing supply. In emerging markets, it is proving demand, permits and unit economics before scaling.
Padel is not one market. It is 91,234 courts, each a local court-hour business. In Germany the question is utilisation, in Spain it is renewal, and in Jakarta it is the right to operate.
Atte Suominen, Founder and CEO, PADEL1969
Global court supply rose 17.9% to 91,234 in ten months, and new clubs are being built 13% larger than the installed base
FIP’s third World Padel Report was presented to the General Assembly in Madrid on 12 October 2026 and published online on 14 October. Its infrastructure survey counts 91,234 courts across 28,497 clubs and accommodation facilities at the end of August 2026, against 77,355 courts and 24,634 facilities in the previous survey: 13,879 more courts (+17.9%) and 3,863 more facilities (+15.7%) in about ten months.
Exhibit 1
Global courts passed 80,000 at the start of 2026 and 90,000 by the end of July
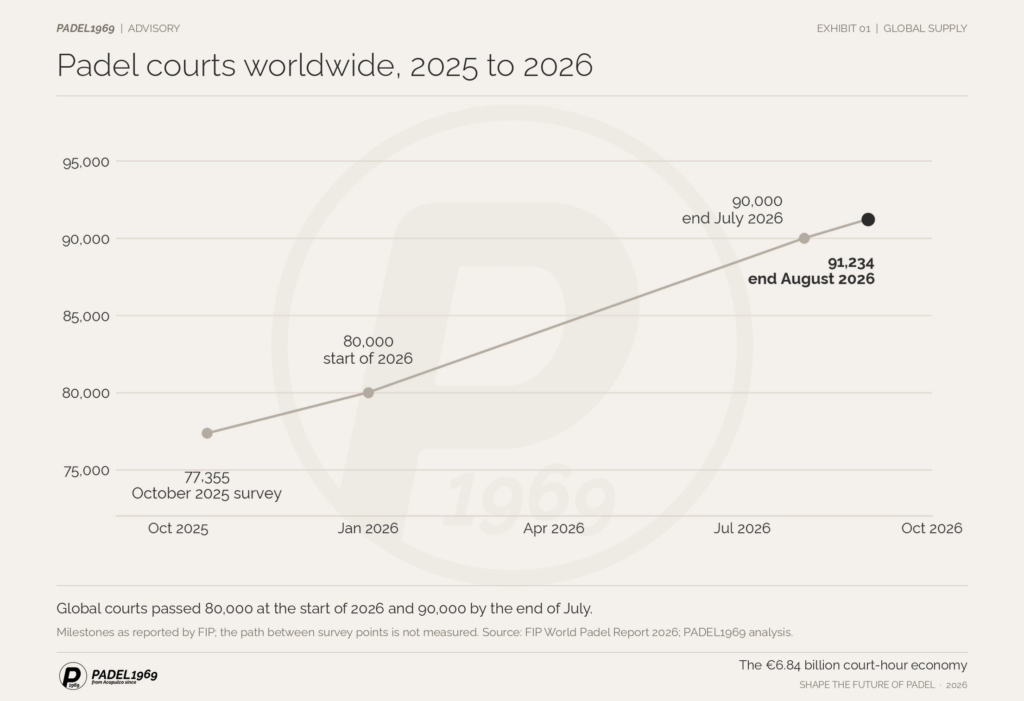
Milestones as reported by FIP; the path between survey points is not measured.
Padel is now reported in 191 countries and territories, 59 of them with more than 100 courts, up from 47. New clubs average 3.6 courts worldwide and 4.1 in Europe, against an installed average of 3.2. Larger clubs indicate a maturing venue model; they do not, by themselves, prove occupancy or profitability.
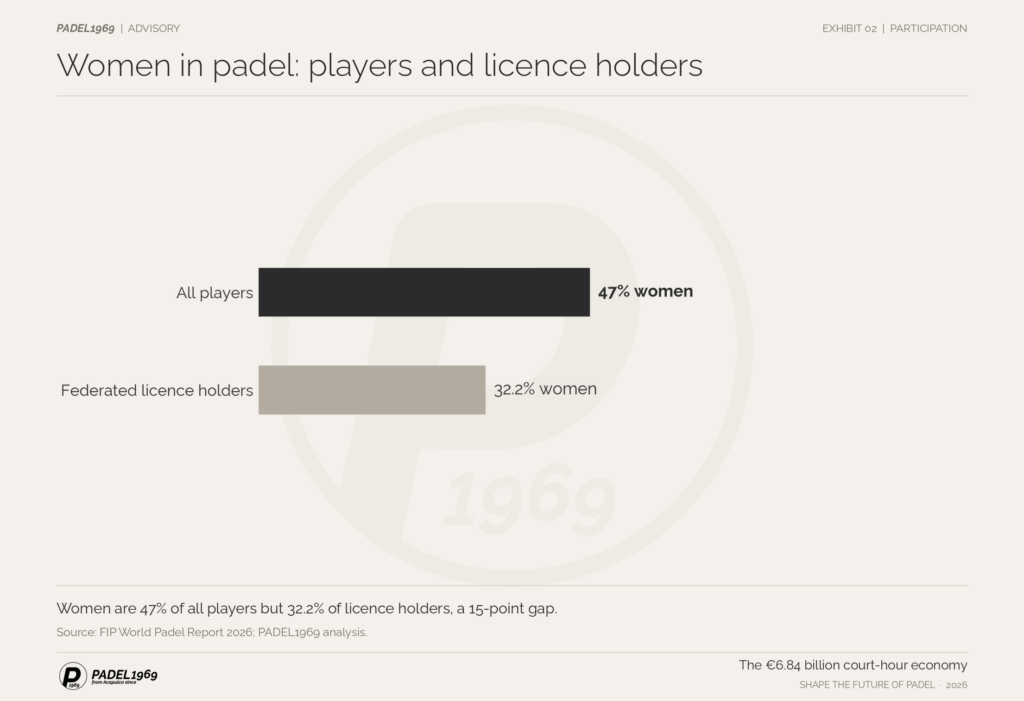
The survey draws on 70 national federations and profiles the 100 affiliated with FIP at the time of compilation; membership rose to 115 at the October 2026 General Assembly. Federated licences reached 1.114 million. Women make up 47% of all players but 32.2% of licence holders, a 15-point gap that marks the clearest development opportunity in the participation data.
Exhibit 2
Women are 47% of all players but 32.2% of licence holders, a 15-point gap
Decision implication
In each city, measure supply in commercially bookable courts and saleable court-hours, not in every court within the municipal boundary. Club, hotel, private and federation-registered courts serve different addressable markets.
Court rental generates €4.60 billion, two of every three euros spent on padel; professional tournaments generate 1.4%
FIP’s new World Padel Impact chapter, developed with OpenEconomics, models €6.843 billion of padel spending in 2026: court rental €4.597 billion (67.2%), construction and maintenance €1.312 billion (19.2%), player equipment €837 million (12.2%) and professional tournaments €97 million (1.4%). This is a modelled annual spending flow, not the enterprise value of the padel industry.
Exhibit 3
Two of every three euros spent on padel pay for court time
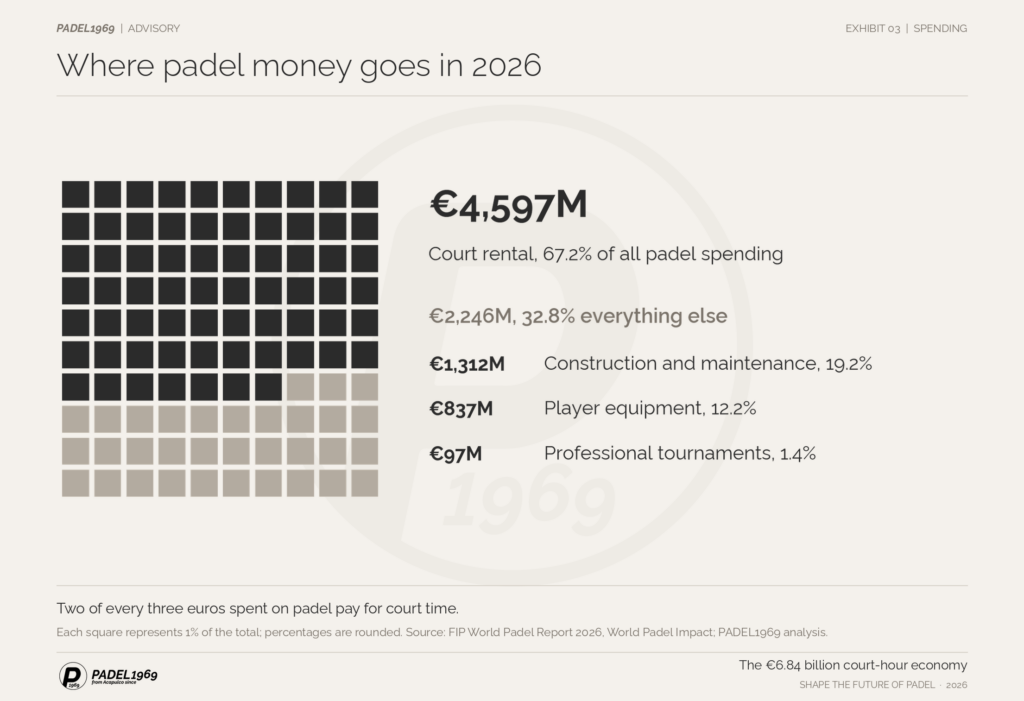
Each square represents 1% of €6,843 million of modelled 2026 spending. Percentages are rounded.
The same model associates this spending with €8.614 billion of GDP, €13.069 billion of total output and 235,663 full-time-equivalent jobs, or €1.26 of GDP for every euro spent. These are input-output results across direct, indirect and induced effects. They must not be added to spending or read as company revenue.
Exhibit 4
Every €1 of padel spending is associated with €1.26 of GDP; the two figures must never be added
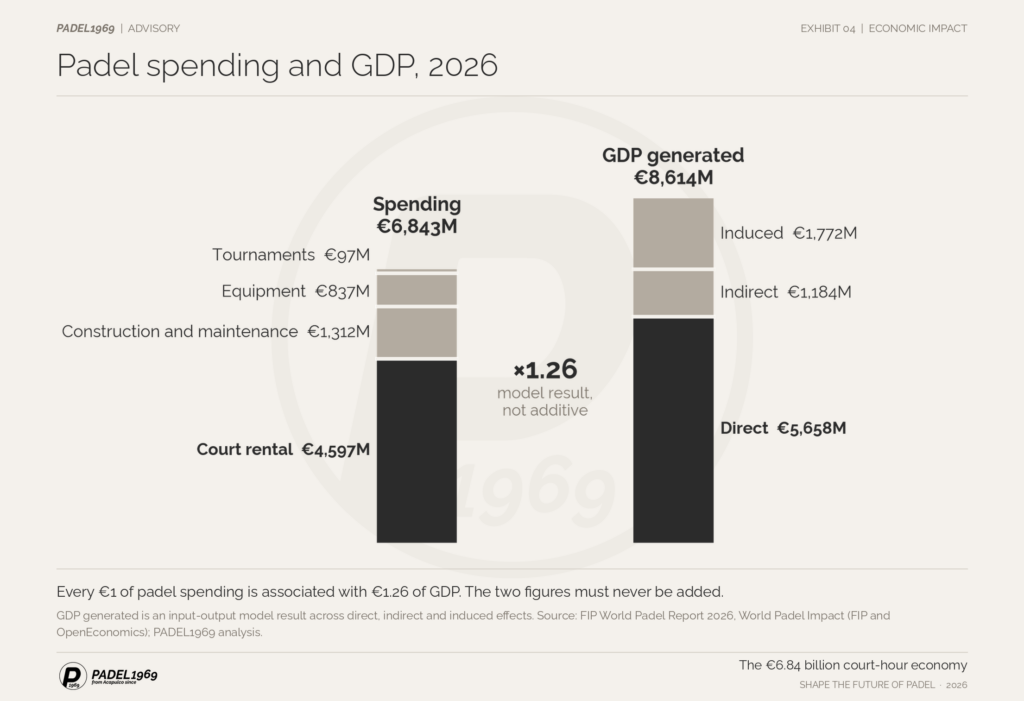
GDP generated is an input-output model result across direct, indirect and induced effects.
For operators, rental is the core recurring transaction. The FIP data does not prove that premium specification drives utilisation, and we do not claim that it does. The investable hypothesis is narrower and testable: playability, acoustics, lighting, structural durability and service reliability affect repeat bookings and lifecycle cost. It should be established on venue-level operating evidence.
Divide FIP’s €117 million of German court rental by Germany’s 2,000 courts, and each court generates roughly €58,500 a year. Over a fifteen-year life that is about €880,000 per court. The purchase price is the smallest number in that equation.
Atte Suominen, Founder and CEO, PADEL1969
Rental revenue is hours × utilisation × yield, and five operating levers decide each term
Annual court-rental revenue = commercially available court-hours × paid utilisation × realised revenue per booked hour. The equation is simple; its inputs are not. A development model should report the hours genuinely saleable after opening schedules, maintenance, weather exposure, lessons and blocked periods, price net of discounts and promotions, and utilisation based on paid bookings rather than registrations or social-media interest.
Exhibit 5
Illustrative: of 5,840 theoretical court-hours a year, fewer than half become paid bookings
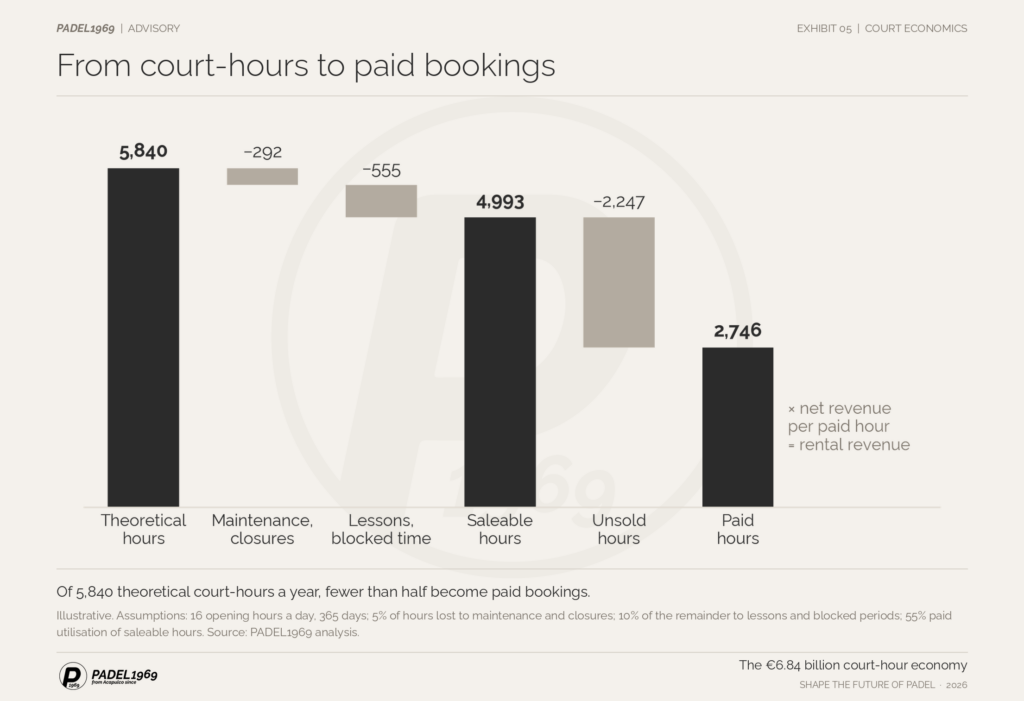
Illustrative single court. Assumptions: 16 opening hours a day, 365 days a year; 5% of hours lost to maintenance and closures; 10% of the remainder to lessons and blocked periods; 55% paid utilisation of saleable hours. Replace with venue data for any investment decision.
| Operating lever | Question to underwrite | Primary evidence |
| Catchment and access | Is the location convenient to enough repeat users? | Travel-time catchment; parking; local competitors |
| Paid utilisation | How many bookable hours will actually sell? | Hourly bookings by daypart and cohort |
| Realised yield | What is the true net revenue per occupied hour? | Actual transactions; discounts; membership allocation |
| Lifecycle cost | What will the asset cost over its useful life? | Maintenance logs; warranty; refurbishment; replacements |
| Regulatory resilience | Can the site operate at the required hours and noise levels? | Permits; acoustic studies; zoning; landlord covenants |
Padel has 19.4, 27 or 40 million players depending on the definition, a twofold spread that cannot be blended in one model
FIP’s headline of more than 40 million counts everyone who played at least once in twelve months. Its 27 million frequent players are a narrower behavioural segment, and its economic model uses a separate forecast of 27.15 million regular players for 2026. Playtomic and Strategy& report 19.4 million active players at the end of 2025. FIP’s 1.114 million federated licences measure competition, not participation.
Exhibit 6
FIP’s broadest player count is 2.1 times the narrowest active-player estimate; its own economic model uses 27.15 million
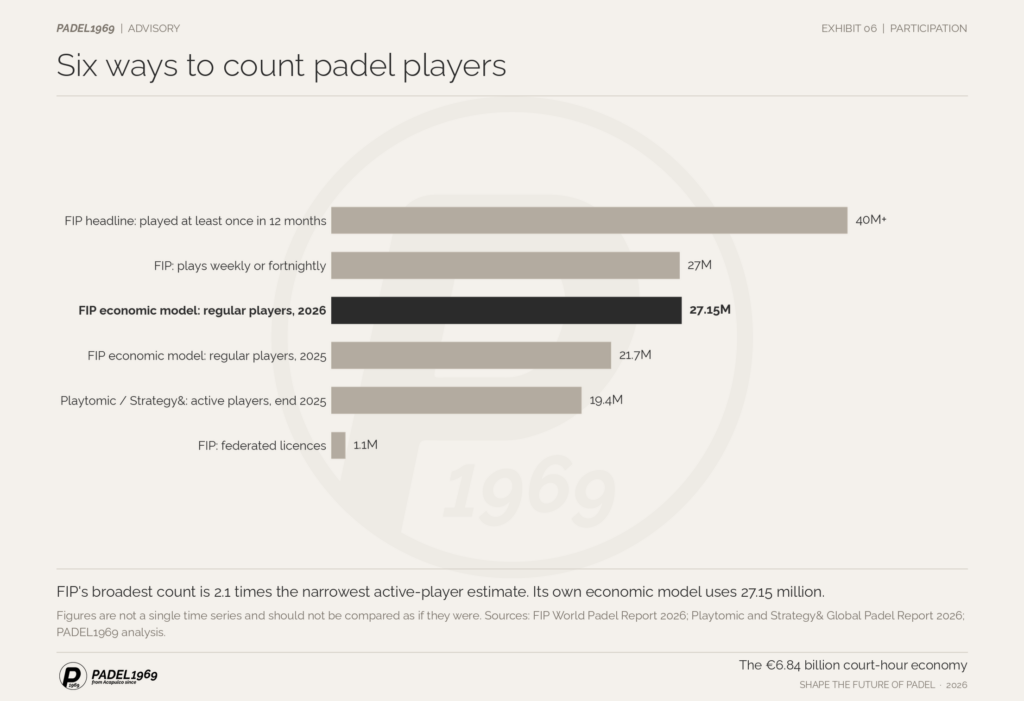
Figures are not a single time series and should not be compared as if they were. FIP’s headline is a lower bound (40 million+).
FIP’s headline says 40 million players. FIP’s own economists model 27.15 million. Underwrite a court against the second number, and against your own catchment, never against the first.
Atte Suominen, Founder and CEO, PADEL1969
Court counts need the same discipline. FIP’s 91,234 is an August 2026 snapshot of every facility where padel is played, including hotels and residential settings. Playtomic and Strategy&’s 58,334 is dated December 2025 and built from manufacturer, platform and federation triangulation. The gap of nearly 33,000 courts reflects scope and date, not error, and neither figure can be substituted for the other in a per-court valuation.
| Measure | FIP 2026 | Playtomic / Strategy& 2026 |
| Court base | 91,234 | August 2026 | 58,334 | end 2025 |
| Court growth | 17.9% | October 2025 to August 2026 | 16% | calendar 2025 |
| Broad participation | 40M+ | played at least once in 12 months | Not directly comparable |
| Repeat or active players | About 27M frequent; 27.15M regular in economic model | 19.4M active | end 2025 |
| Coverage | Federation survey; all facilities, including accommodation | Manufacturer, platform and federation triangulation |
Research rule
State the source, definition, reference period and geography every time a market-size figure is used. Use booking demand and local utilisation, not a global participation headline, to support site-level underwriting.
Asia built 31.7% of the world’s new courts, up from 10.0%, while Europe still holds 62.5% of the installed base
The installed base remains concentrated in Europe, with 56,981 courts (62.5%). The Americas account for 20,259 (22.2%), Asia 9,026 (9.9%), Africa 4,732 (5.2%) and Oceania 236 (0.3%). Growth is more dispersed: Asia added 4,393 courts, up 95% on the prior survey, against 5,881 in Europe, 2,136 in the Americas and 1,343 in Africa.
Exhibit 7
Asia’s court base grew 95% in ten months; Europe still added the most courts, 5,881
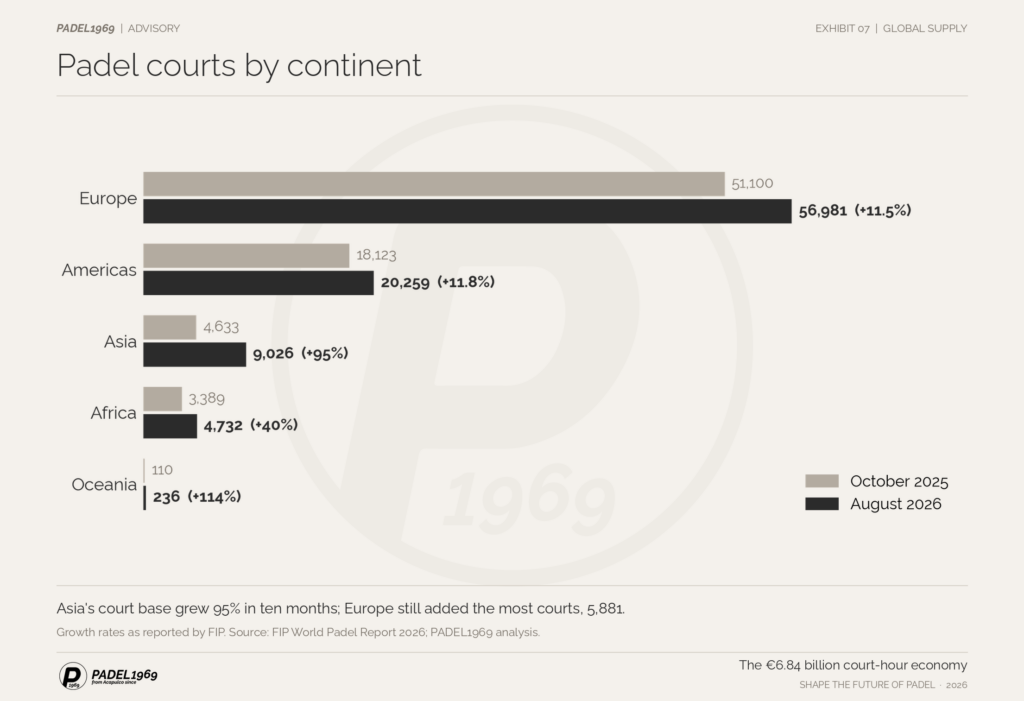
Court stock at two survey dates, October 2025 and August 2026. Growth rates as reported by FIP.
Europe’s share of newly installed courts fell from 59.2% in the previous survey to 42.4%. Asia’s rose from 10.0% to 31.7%, and Asia opened more new clubs than Europe for the first time: 39.0% against 37.1%. This is a shift in where capital is being deployed, not proof that every new venue will meet the same quality or demand threshold.
Exhibit 8
Asia’s share of new courts more than tripled, from 10.0% to 31.7%
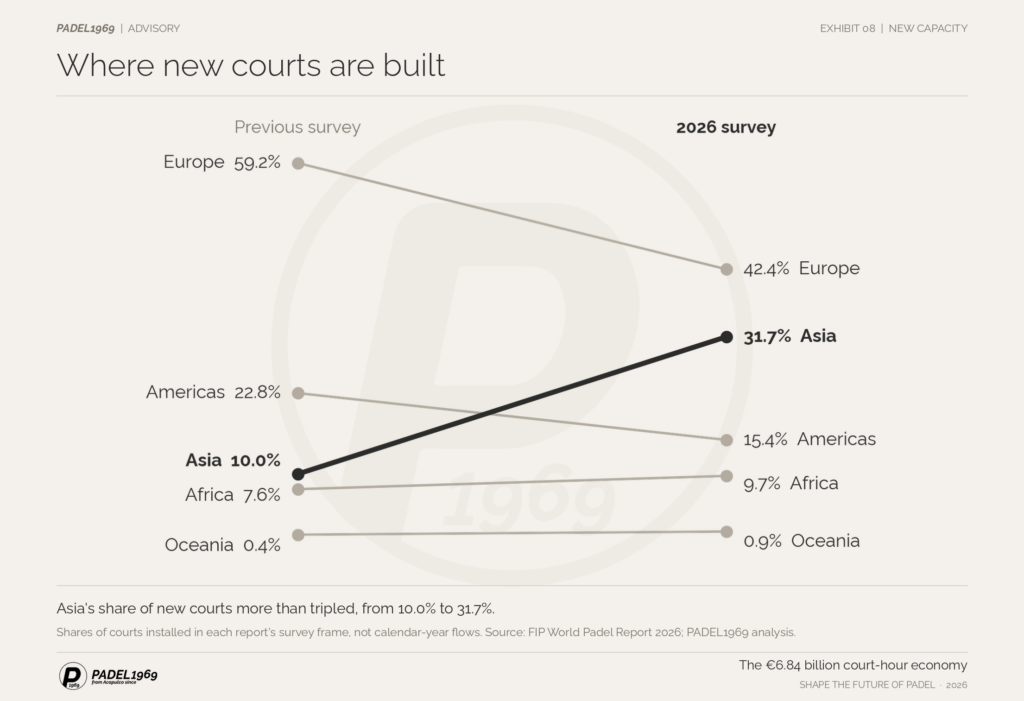
Shares of courts installed in each report’s survey frame, not calendar-year flows.<
Indonesia added 2,534 courts in one survey cycle; in Jakarta, 185 of 397 padel facilities lacked a building permit
Indonesia recorded 2,534 additional courts and 769 additional clubs in the FIP survey, reaching 3,300 courts. Development at that speed raises practical questions about planning consent, noise, neighbouring land uses and sustained utilisation. Jakarta illustrates the point. The city’s Department of Public Works, Spatial Planning and Land Affairs recorded 397 padel facilities as of 23 February 2026, of which 185 lacked a building approval (PBG). Following residents’ complaints about noise, Governor Pramono Anung announced on 24 February 2026 that no new padel permits would be issued in residential zones and that licensed courts in residential areas must close by 8:00 p.m. and install soundproofing. By early March 2026, 206 operators had received administrative sanctions.
FIP notes that installation costs in some high-growth Asian markets can be 70 to 80% lower than in Europe or North America. That is a construction-cost comparison, not a lifecycle-value ranking. Investors still need like-for-like evidence on specification, structural design, permits, operating hours, upkeep and useful life.
In Jakarta, 185 of 397 padel facilities had no building permit when the city counted them. An installation cost 70 to 80% below Europe’s buys speed. It does not buy the right to operate after 8 p.m. in a residential street.
Atte Suominen, Founder and CEO, PADEL1969
Germany projects 111.5% court growth for 2026 and leads the world in on-site construction spend at €79 million
Europe is not one maturity story. FIP places Germany, Great Britain, France, the Netherlands and Greece in a growth phase; Spain, Italy, Portugal, Norway and Finland in consolidation; and Ireland, Ukraine, Estonia, Poland and Russia among emerging markets. That segmentation is a better basis for capital allocation than any claim that padel as a whole is mature.
Exhibit 9
Europe runs at three speeds: Germany and Great Britain project growth above 100%, Spain and Italy below 3%
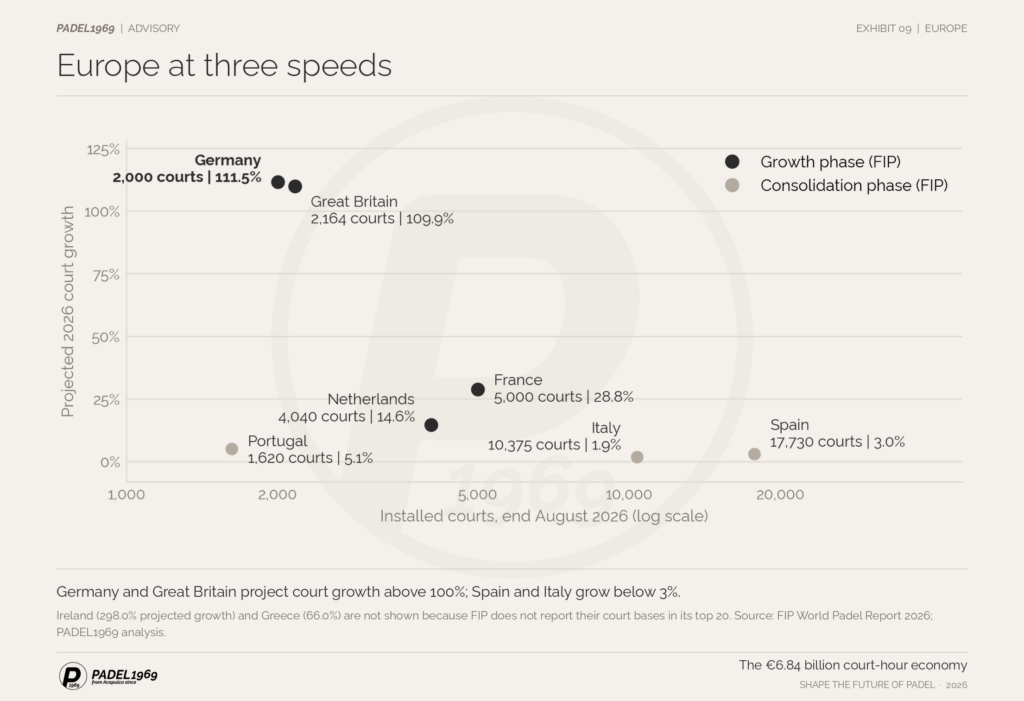
Projected full-year 2026 court growth against installed courts. Ireland (298.0% projected growth) and Greece (66.0%) are not shown because FIP does not report their court bases in its top 20.
Germany added 911 courts between FIP surveys, Great Britain 978 and France 889. On FIP’s projected full-year basis, Germany reaches 111.5% and Great Britain 109.9%. Additions and projections are different measures, and investor presentations should not mix them.
Germany also records the highest on-site court-building expenditure in FIP’s 2026 country analysis: €79.0 million, against €64.8 million in the United Kingdom and €52.6 million in France. The metric excludes payments to court manufacturers (€34.7 million in Germany), so it is neither total court-market revenue nor full construction capex.
Exhibit 10
Germany’s on-site construction spend is 22% above the United Kingdom’s and 50% above France’s
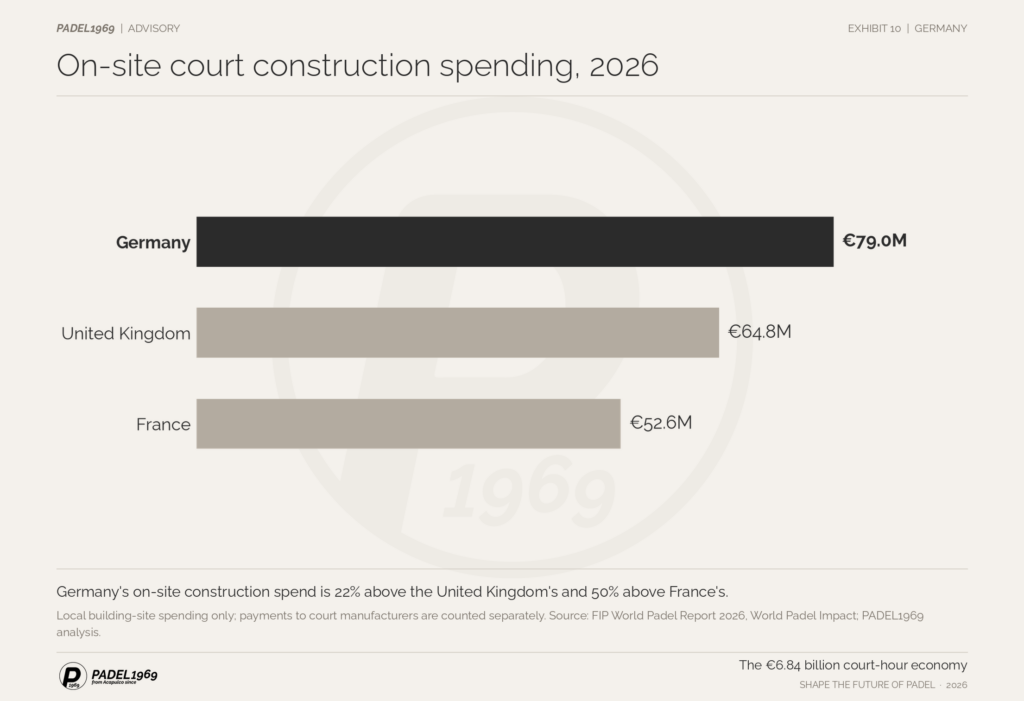
Local building-site spending only; payments to court manufacturers are counted separately.
For German developers, due diligence now extends well beyond securing a court supplier: indoor height and environmental conditions, structural sign-off, acoustics, lighting, planning, operating layout and future maintenance belong at specification stage. This reflects PADEL1969‘s operating experience rather than a causal finding of the FIP dataset.
Germany added 911 courts in ten months and will spend €79 million on building sites this year. Each of those courts is a fifteen-year decision on structure, acoustics and light. German operators are no longer sourcing courts. They are sourcing partners.
Atte Suominen, Founder and CEO, PADEL1969
Spain and Italy grow at 3.0% and 1.9%, and Sweden’s estimate fell by 470 courts: consolidation creates a renewal market, not an exit
Spain remains the largest padel market with 17,730 courts, followed by Italy with 10,375. FIP projects 2026 court growth of 3.0% in Spain and 1.9% in Italy. Sweden is counted at 3,750 courts at the end of August 2026, against 4,220 in FIP’s mid-2025 estimate. The difference of 470 reflects a revision of FIP’s estimate between two reference dates rather than a verified count of closures, although Swedish media have documented hall closures, bankruptcy auctions and the sale of used courts abroad.
The economic model still attributes €275 million of 2026 padel spending to Sweden. A sizeable spending base can persist after a supply correction, although that alone does not establish the profitability of the remaining venues. Sizing the renewal market requires age-cohort, condition and closure data.
FIP models 548 courts decommissioned worldwide in 2026. Sweden’s estimate alone fell by 470 between two reports. Replacement will become Europe’s next construction market, and it will reward durability in a way the first build never did.
Atte Suominen, Founder and CEO, PADEL1969
The Americas passed 20,000 courts, but the United States has about 3 courts per million people against Spain’s 360
The Americas account for 20,259 courts, up 2,136 on the prior survey. Argentina remains the largest established market with 7,450 courts; Brazil added 494 and Colombia 241. The United States added 309 courts to reach 1,160, roughly 3 per million inhabitants against about 360 per million in Spain. Population alone does not validate a padel investment: market education, real estate economics, access and the local sports mix all remain material.
American developers should therefore test more than one operating format, including integrated racquet clubs, mixed-use developments and hospitality venues, rather than assume that a European premium padel-club template will translate unchanged. This is a PADEL1969 strategic view, not an outcome demonstrated by the FIP counts.
Egypt and South Africa delivered 1,011 of Africa’s 1,343 new courts
FIP reports 4,732 courts in Africa, up 1,343 since its previous survey, with Egypt (+700) and South Africa (+311) accounting for three quarters of the new stock. Oceania has 236 courts, including more than 170 in Australia. Growth from small bases should be presented alongside absolute additions when comparing these markets with established ones.
Spain and Italy account for €1.92 billion, 28% of padel spending, but half of the top ten spending markets are still building out
Spain is the largest market in the World Padel Impact model at €1.109 billion (16.2% of the global estimate), followed by Italy at €810 million. France (€407 million), the United Kingdom (€343 million), the Netherlands (€298 million), Germany (€257 million) and Indonesia (€232 million) already rank in the top ten despite more recent development. Today’s growth hotspots and today’s spending hotspots are different geographies.
Exhibit 11
Two consolidating markets, Spain and Italy, generate 28% of global padel spending
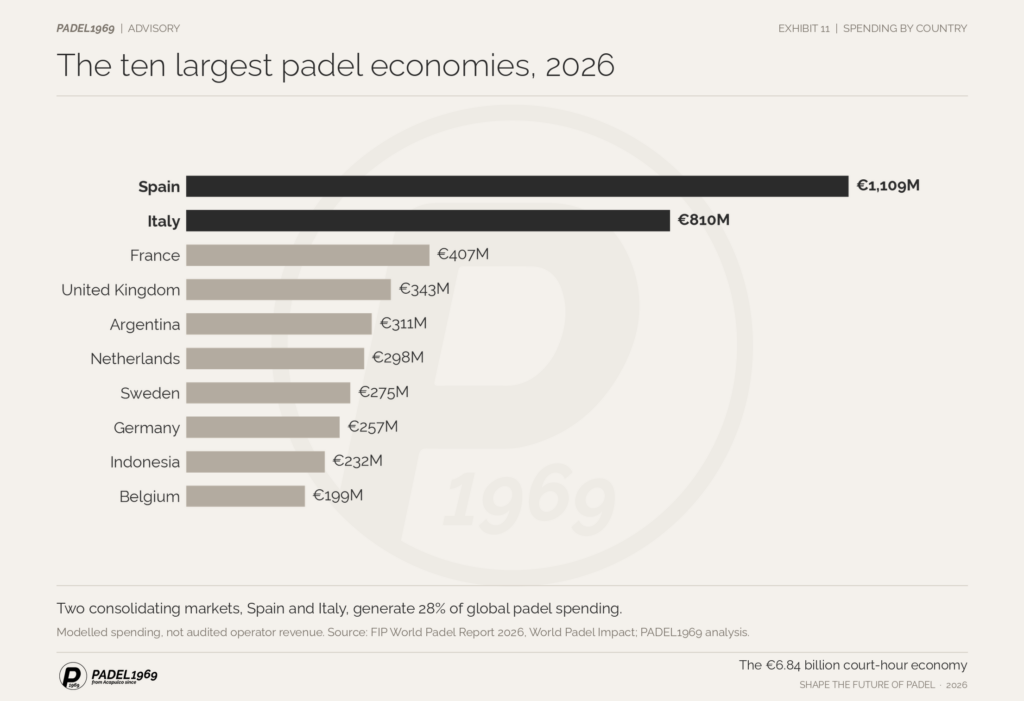
2026 modelled spending, not audited operator revenue.
Sweden ranks highest for modelled GDP contribution per inhabitant (€27.95), ahead of Spain (€22.00), Denmark (€18.92), Belgium (€17.78), the Netherlands (€17.44) and Finland (€16.51). Per-capita impact measures the intensity of padel activity. It is not a measure of court-level profitability or of headroom for additional venues.
Exhibit 12
Sweden generates €27.95 of padel GDP per inhabitant, 27% more than Spain
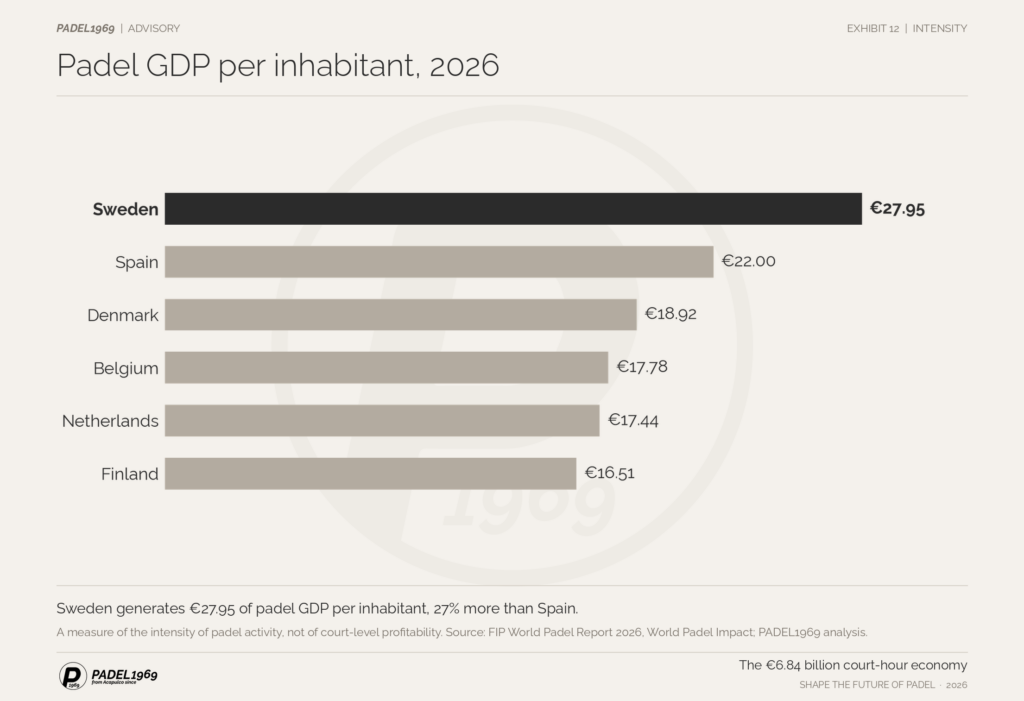
Modelled 2026 GDP contribution per inhabitant; top six countries in FIP’s model.
Sweden still generates €27.95 of padel GDP per inhabitant, more than any other country in FIP’s model, years after its boom ended. A correction is not a collapse. What contracted was an investment model, not the sport.
Atte Suominen, Founder and CEO, PADEL1969
Three market stages require three playbooks, from build-out markets growing above 100% to consolidating markets growing below 3%
Exhibit 13
Four stages, one cycle: where key markets sit in 2026
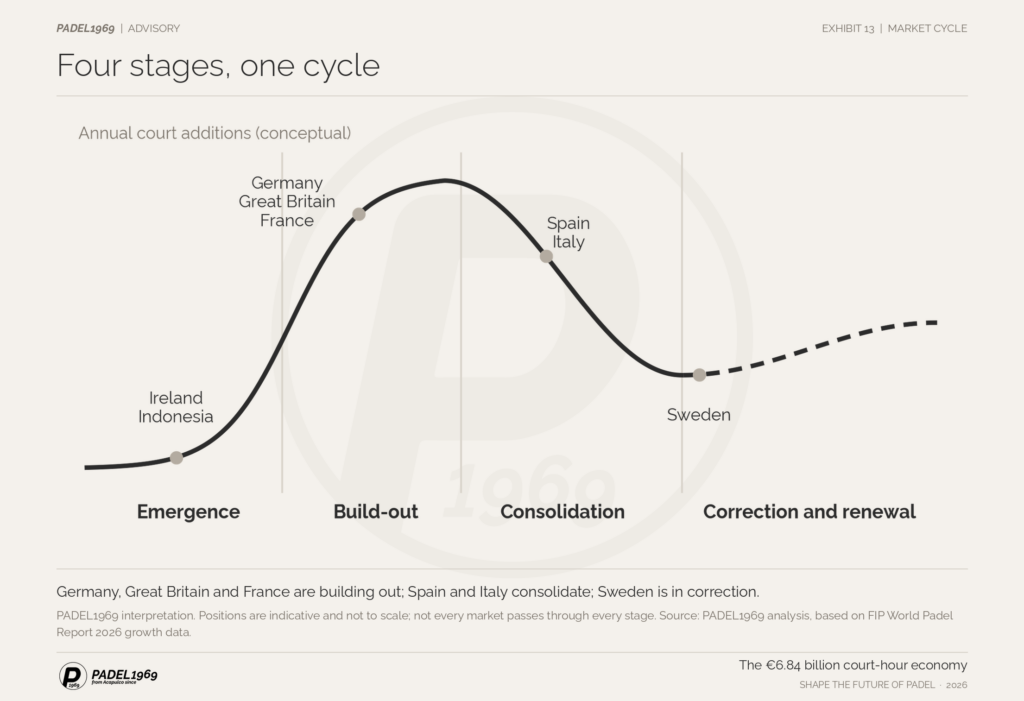
PADEL1969 interpretation. Positions are indicative and not to scale; not every market passes through every stage.
| Market stage | Illustrative markets | Primary investment question | Required evidence |
| Scale and professionalise | Germany, Great Britain, France | Can new facilities win repeat users and sustain premium utilisation? | Location-level bookings, net yield, occupancy ramp, capex, permits |
| Upgrade and optimise | Spain, Italy, Sweden | Does renovation or replacement improve yield and lower lifetime cost? | Asset-condition census, closure reasons, maintenance and refurbishment returns |
| Establish and govern | Indonesia and other emerging markets | Can operating standards and recurring demand keep pace with new supply? | Planning compliance, comparable venues, demand cohorts, lifecycle economics |
Each playbook carries a different risk. Build-out projects carry ramp-up and competitive-entry risk. Renewal projects carry specification and incremental-return risk. Emerging markets carry regulatory, location and market-formation risk. Investment committees should demand different evidence in each setting rather than rely on a uniform narrative of global growth.
FIP tournaments rise 50% to 434 in 2026, yet professional events account for 1.4% of spending
FIP reports 434 tournaments for 2026, against 289 in 2025, held across 62 countries. Professional padel builds awareness, aspiration and participation. In the World Padel Impact model, however, tournaments account for €97 million, 1.4% of measured spending. The economic centre of gravity remains everyday court use.
Five controls prevent a €6.84 billion spending estimate from being read as a market valuation
1 Use explicit measurement dates. Court stock is an end-August 2026 snapshot; some growth rates compare with the October 2025 survey and others are projections for full-year 2026.
2 Preserve source definitions. FIP’s broad facility census, Playtomic’s conservative mapping, frequent players, active players and federation licences cannot be swapped into one denominator.
3 Label modelled economics. All 2026 World Padel Impact spending, GDP and employment figures are model estimates, not audited valuations, revenue statements or investment returns.
4 Do not overclaim causality. Growing supply, rising search interest or a large spending pool does not establish venue-level returns; quality and maintenance propositions need operating evidence.
5 Separate evidence from interpretation. Market-stage classifications and investment implications are PADEL1969 judgements unless attributed to FIP. Municipal enforcement data are cited in the sources.
Scope note
FIP’s 14 October 2026 release cites approximately 20.4% annual court growth and rounded figures for clubs and licences. This paper uses the two dated survey snapshots to calculate 17.9%. Both readings are valid within their own periods and population definitions.
In a market adding 14,618 courts a year, advantage shifts from building fastest to earning longest
The 2026 data does not describe a saturated sport. It describes expansion at scale alongside local markets in consolidation, professionalisation and renewal. With 91,234 courts in the latest FIP survey and two thirds of modelled spending generated by rental, the financial relevance of a court extends well beyond the day it is installed.
The strategic question for the coming decade is therefore not who can build the most courts fastest. It is who can choose the right catchments, sustain the best player experience, protect the right to operate and generate resilient court-hour economics over the useful life of each facility. That is where development discipline, product quality and long-term capital alignment become competitive advantages.
FIP counts a new court every 36 minutes. The question for the next decade is not how many are built, but how many are still the right court in fifteen years.
Atte Suominen, Founder and CEO, PADEL1969
PADEL1969 | SHAPE THE FUTURE OF PADEL
Contact: [email protected]
Sources and definitions
International Padel Federation (FIP), World Padel Report 2026, published 14 October 2026. https://www.padelfip.com/world-padel-report-2026/
FIP release, “FIP World Padel Report 2026 is online,” 14 October 2026. https://www.padelfip.com/2026/10/fip-world-padel-report-2026-is-online-more-than-40-million-players-courts-up-by-20-and-a-new-study-on-economic-impact-e8-6-billion-in-gdp/
Playtomic and PwC Strategy&, Global Padel Report 2026. https://playtomic.com/global-padel-report
Jakarta: Jakarta Provincial Government press release, 24 February 2026 (jakarta.go.id); Beritajakarta, 6 March 2026. Sweden 2025 estimate: FIP World Padel Report 2025, court data as of mid-2025.
Court density per million inhabitants uses national population estimates of about 342 million for the United States and 49 million for Spain. Per-court rental in Germany divides FIP’s modelled €117.1 million of 2026 German court rental by FIP’s 2,000 German courts.
Market-stage interpretations, quotations and underwriting recommendations in this paper are PADEL1969 analysis.
About the author and PADEL1969
Atte Suominen is Founder and CEO of PADEL1969, a premium padel court manufacturer and advisory company. PADEL1969 has delivered more than 1,500 courts worldwide and works with operators, property developers and capital partners on venue strategy, market entry, court delivery and the long-term economics of padel infrastructure.